 Medicare Advantage coverage providers have started the year with 24 million enrollees, or about 9.2% more than they had a year ago. The total number of people eligible for Medicare grew 6.4%, to 68 million.
The Medicare Advantage program’s share of all people eligible for Medicare increased to 35%, from 34% last year.
The Centers for Medicare and Medicaid Services (CMS), the agency that runs the Medicare program, has published the latest Medicare eligibles data and the Medicare Advantage enrollee numbers in the Monthly Enrollment by State 2020 01 data file.
The data file also gives information about related matters, such as the number of people with stand-alone Medicare Part D prescription drug coverage. The number of people with stand-alone drug coverage fell 1.1%, to 25 million
The data file provides data for all 50 states, U.S. territories, and the District of Columbia.
The Medicare Advantage program gives commercial health insurers and managed care companies a chance to provide an alternative to what CMS calls “Original Medicare” coverage.
Some Medicare enrollees use Medicare supplement insurance to fill in the gaps in Original Medicare programs. Other people use Medicaid; sign up for new or experimental programs, such as PACE plans; or have no protection against health care costs other than Original Medicare itself.
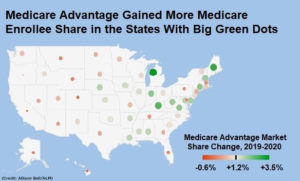
We compared the latest data with the year-earlier data and created a map showing where the Medicare Advantage program’s share of all Medicare-eligible people grew, shrank or held steady in the 50 states. You can see the map above. In states with big, bright green dots, Medicare Advantage plans increased their share of those state’s Medicare-eligible residents more than about 2%.
In states with bigger, darker red dots, Medicare Advantage plan issuers reported weak enrollee share growth, or a small drop in enrollee share.
For data on all 50 states, see the table below.
| State | 2020 Medicare Eligible Population | 2020 MA Enrollees | 2020 MA Enrollee Share | 2019 MA Enrollee Share | MA Enrollee Share Change |
| Alabama | 1,145,997 | 469,362 | 41.0% | 39.1% | 1.9% |
| Alaska | 111,653 | 1,243 | 1.1% | 1.1% | 0.0% |
| Arizona | 1,488,153 | 565,969 | 38.0% | 37.5% | 0.5% |
| Arkansas | 711,544 | 184,533 | 25.9% | 24.1% | 1.8% |
| California | 6,972,641 | 2,721,137 | 39.0% | 39.7% | -0.6% |
| Colorado | 1,054,792 | 385,683 | 36.6% | 36.7% | -0.1% |
| Connecticut | 741,609 | 298,817 | 40.3% | 37.9% | 2.4% |
| Delaware | 227,070 | 37,624 | 16.6% | 14.5% | 2.1% |
| Florida | 5,132,645 | 2,210,426 | 43.1% | 42.8% | 0.3% |
| Georgia | 1,966,018 | 727,162 | 37.0% | 36.3% | 0.7% |
| Hawaii | 294,374 | 130,560 | 44.4% | 44.5% | -0.1% |
| Idaho | 375,374 | 122,792 | 32.7% | 31.5% | 1.2% |
| Illinois | 2,445,483 | 598,491 | 24.5% | 22.8% | 1.6% |
| Indiana | 1,385,965 | 440,430 | 31.8% | 29.5% | 2.3% |
| Iowa | 684,155 | 143,273 | 20.9% | 19.2% | 1.7% |
| Kansas | 589,268 | 110,431 | 18.7% | 17.1% | 1.6% |
| Kentucky | 1,023,238 | 342,788 | 33.5% | 30.7% | 2.8% |
| Louisiana | 958,371 | 359,883 | 37.6% | 35.6% | 1.9% |
| Maine | 374,260 | 133,063 | 35.6% | 32.5% | 3.1% |
| Maryland | 1,148,141 | 129,900 | 11.3% | 11.0% | 0.3% |
| Massachusetts | 1,454,459 | 319,951 | 22.0% | 21.6% | 0.4% |
| Michigan | 2,264,501 | 930,362 | 41.1% | 37.6% | 3.5% |
| Minnesota | 1,142,917 | 431,218 | 37.7% | 36.8% | 1.0% |
| Mississippi | 669,734 | 136,500 | 20.4% | 18.7% | 1.7% |
| Missouri | 1,378,401 | 486,126 | 35.3% | 34.4% | 0.8% |
| Montana | 257,227 | 46,860 | 18.2% | 17.9% | 0.3% |
| Nebraska | 381,207 | 64,491 | 16.9% | 14.9% | 2.0% |
| Nevada | 595,481 | 213,178 | 35.8% | 35.2% | 0.6% |
| New Hampshire | 333,482 | 62,597 | 18.8% | 16.6% | 2.2% |
| New Jersey | 1,789,725 | 511,429 | 28.6% | 27.3% | 1.3% |
| New Mexico | 468,665 | 164,557 | 35.1% | 33.9% | 1.2% |
| New York | 3,972,806 | 1,564,491 | 39.4% | 38.6% | 0.7% |
| North Carolina | 2,217,921 | 793,099 | 35.8% | 34.5% | 1.3% |
| North Dakota | 144,803 | 5,687 | 3.9% | 3.2% | 0.7% |
| Ohio | 2,536,828 | 994,840 | 39.2% | 37.9% | 1.3% |
| Oklahoma | 832,902 | 177,317 | 21.3% | 19.8% | 1.5% |
| Oregon | 969,097 | 406,939 | 42.0% | 42.6% | -0.6% |
| Pennsylvania | 2,958,453 | 1,203,148 | 40.7% | 40.4% | 0.3% |
| Rhode Island | 241,012 | 91,268 | 37.9% | 36.8% | 1.1% |
| South Carolina | 1,185,056 | 328,870 | 27.8% | 26.4% | 1.4% |
| South Dakota | 200,999 | 16,130 | 8.0% | 7.1% | 0.9% |
| Tennessee | 1,505,999 | 574,234 | 38.1% | 37.6% | 0.5% |
| Texas | 4,646,695 | 1,719,265 | 37.0% | 36.4% | 0.6% |
| Utah | 440,621 | 159,016 | 36.1% | 35.3% | 0.8% |
| Vermont | 164,825 | 19,900 | 12.1% | 10.9% | 1.2% |
| Virginia | 1,711,898 | 351,749 | 20.5% | 18.3% | 2.3% |
| Washington | 1,517,678 | 491,585 | 32.4% | 31.5% | 0.9% |
| West Virginia | 481,867 | 147,635 | 30.6% | 28.5% | 1.9% |
| Wisconsin | 1,287,226 | 493,015 | 38.3% | 37.1% | 2.2% |
| Wyoming | 122,816 | 4,141 | 3.4% | 3.3% | 1.2% |